Create a plot frame in ePLAN
The easiest way to create a plot frame in ePLAN is to first copy an existing one from the master data and then make changes on the copied plot frame.
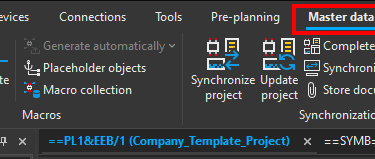
To copy an existing plot frame click on the Master data ribbon and then click on Plot frame and then on Copy command.

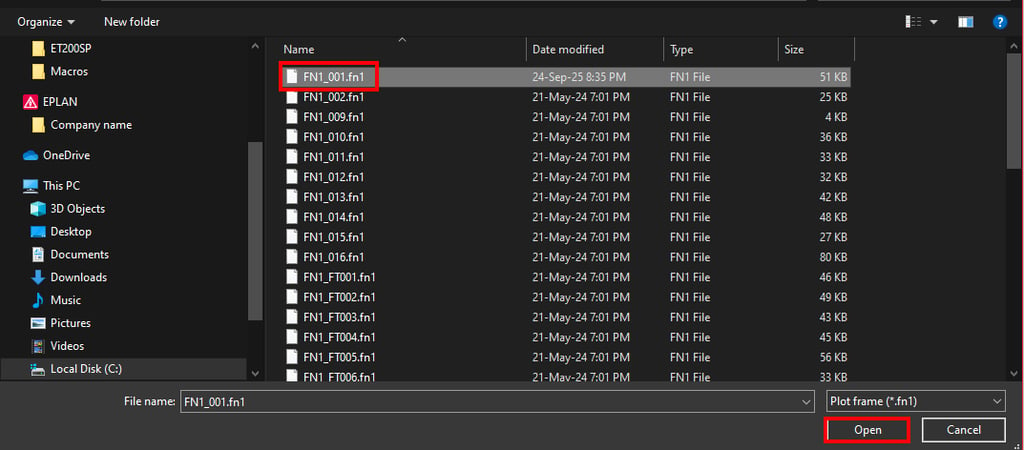
Now we will select the FN1_001.fn1 plot frame to be copied and then click on the Open button.
Now the Create plot frame window will open. Here we can give the new plot frame a name, in this case we will give the new plot frame the Company_plot_frame name, then we will click on the Save button.


Now the newly created plot frame will be opened for editing at the top of the current project under the name that we specified when we were creating the new plot frame.


Double click on the plot frame to open it for editing.
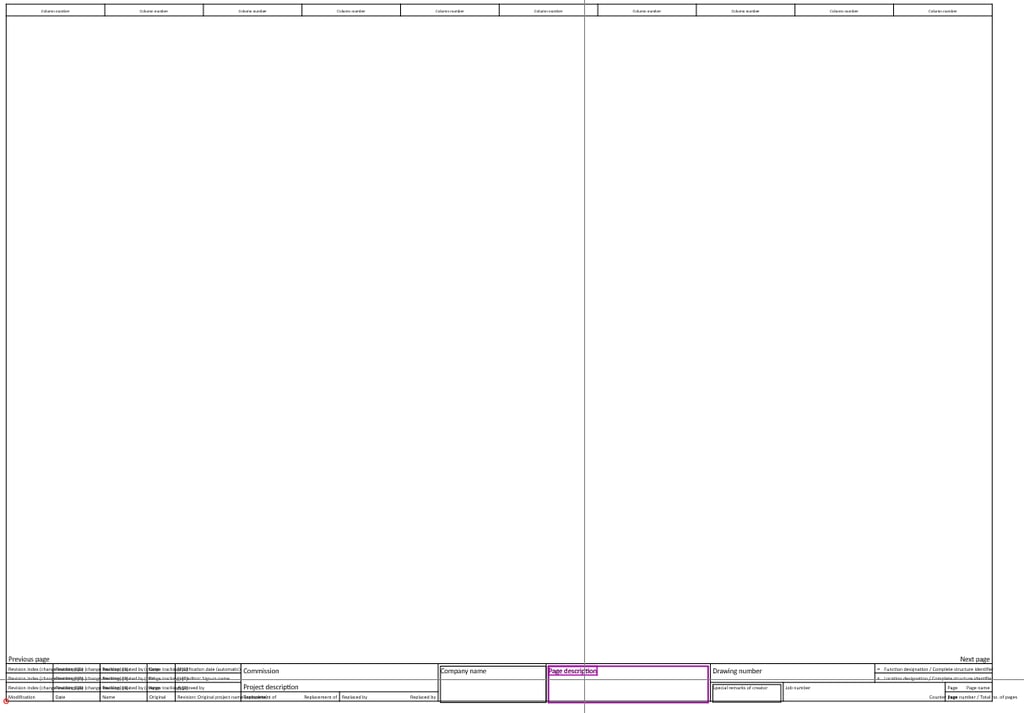

This plot frame contains the page frame and it contains column numbers as well as the plot frame itself at the bottom. Column numbers are used when cross-referencing interruption points and devices to other pages. By default column numbers start from 0 and then they increment by 1 from left to right. Column numbering can be changed by manually entering numbers in the column number fields or they can be set up in a way that every page has unique column numbers or they can be even deleted entirely.
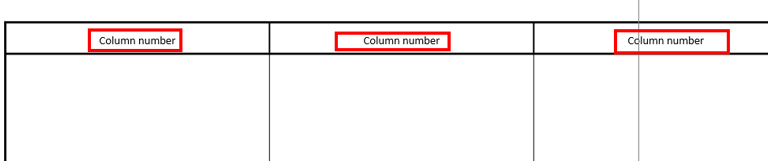
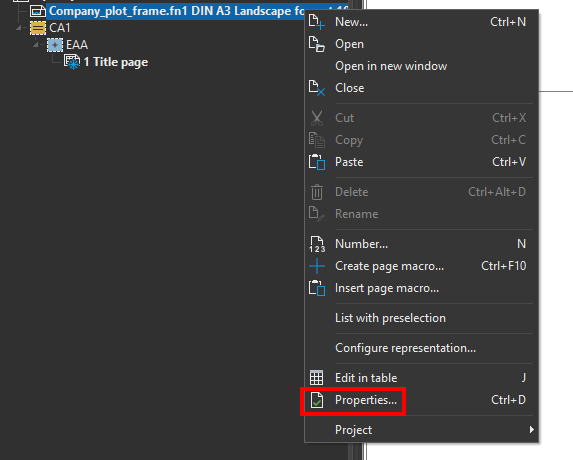
This plot frame that that we are currently editing is A3 paper size and it has 10 columns, each column is 42 mm width. To change plot frame properties select the plot frame in the page navigator and then click on Properties.
Now the Plot frame properties window will open, here you can change the plot frame size, number of rows and columns and other settings.
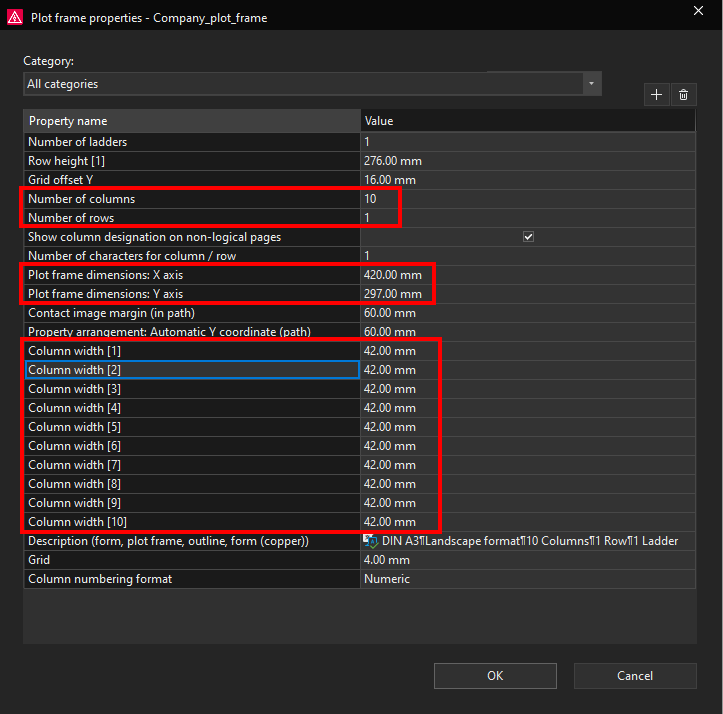
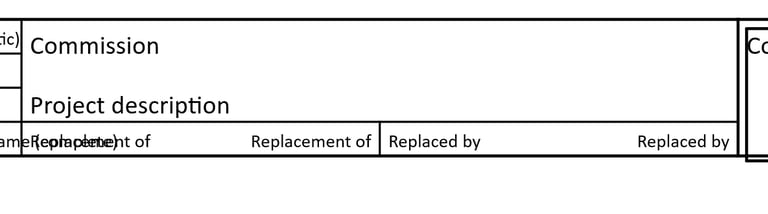
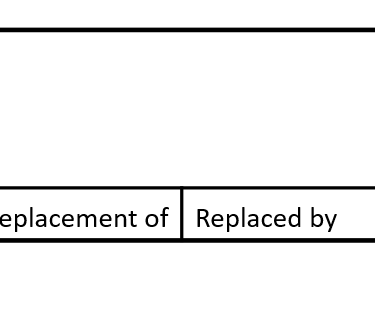
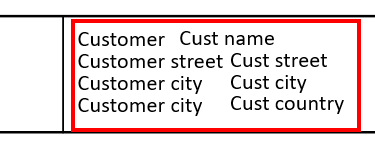
In this case we will leave the page size and number of rows like it is in the current settings. Now we will switch to the bottom of the plot frame where the plot frame content is. We will change the middle part of the plot frame and add the customer name and customer address.
We will start by deleting the Replacement of and Replaced by properties and be deleting the graphical line in the middle and we will also shorten the graphical line under the Project description.
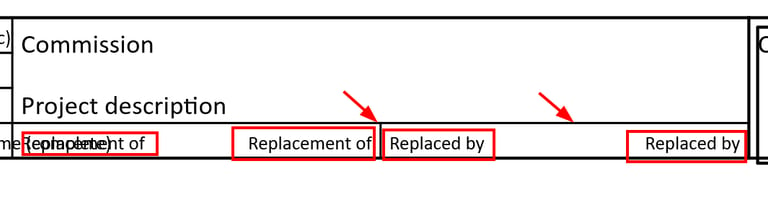
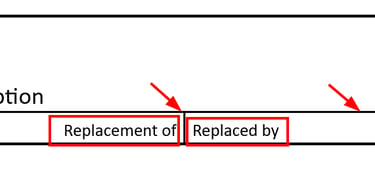
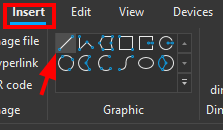
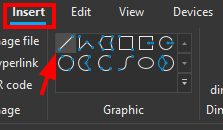
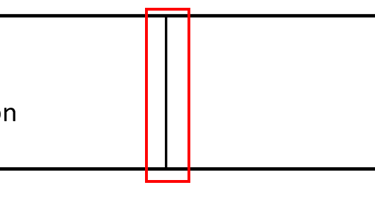
Then by inserting a graphical line from the Insert ribbon we will insert a line in the middle and in this way we will create space for the customer data.
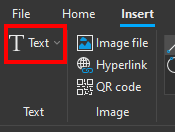
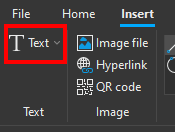
Now we will insert a Text element by clicking on the Insert ribbon and then on the Text command.
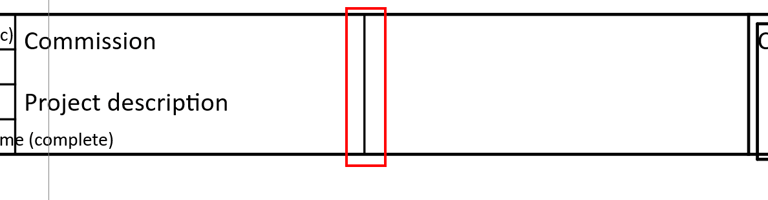
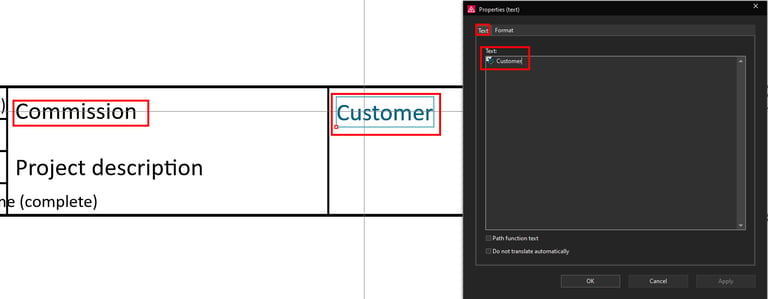
We will write Customer and we will place the text on the right of the newly inserted graphical line but in the same height as the Commission text.
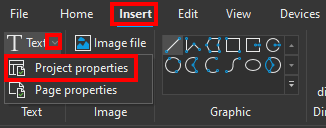
Now we will insert a Special text Project property from the Insert ribbon by clicking on the small arrow next to the Text command and then clicking on the Project properties.
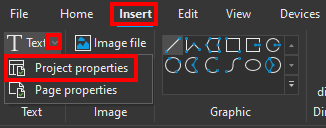
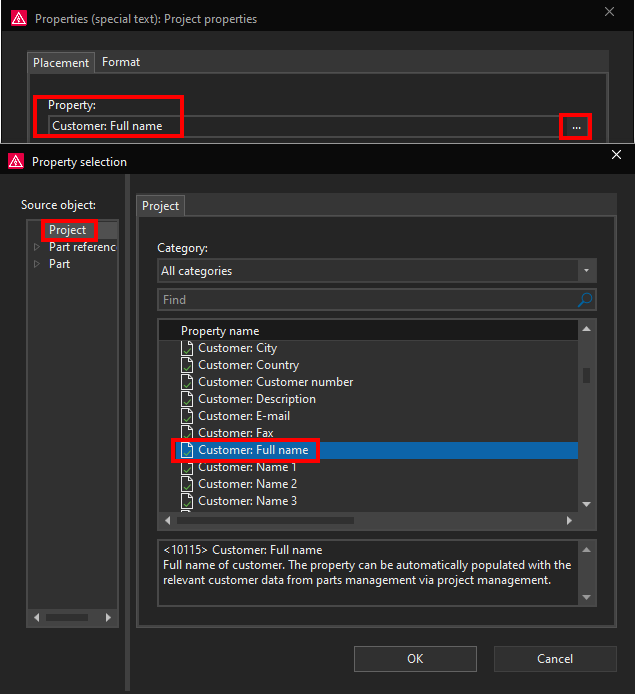
We will select the Customer: Full name property.
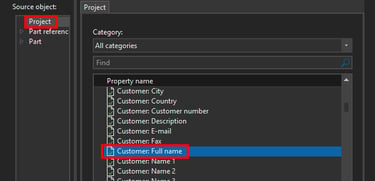
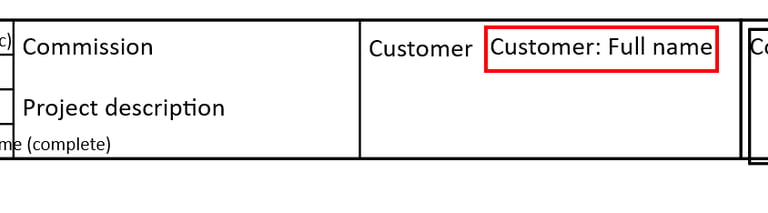
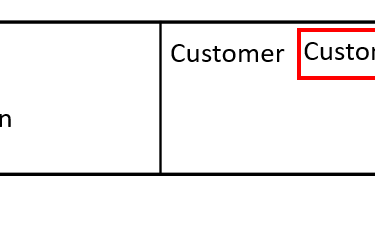
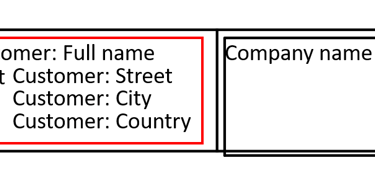
Now we will place the Customer: Full name property next to the Customer text element on the plot frame.
In ePLAN, Special Texts are placeholders used in forms, plot frames, and reports to automatically display project data. The key difference between Project Properties and Page Properties is simply: What level of the project structure they pull data from.
Special text – Project properties – Have access to global project-level information
Typical content:
Project name
Project number
Customer name
Company name
Engineer / designer
Creation date
Project properties special texts have the same value on every page and they are defined once in Project properties.
Special text – Page properties – Have access to local page information.
Typical content:
Page name
Page description
Page number
Installation location
Function (higher-level function)
Page type (schematic, layout, etc.)
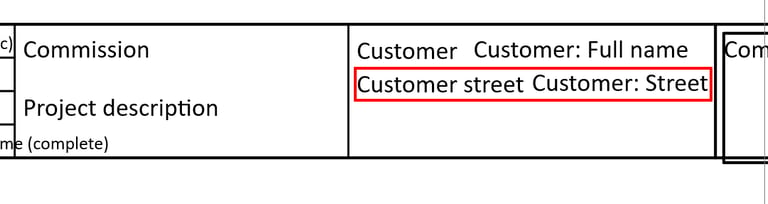
Now we will add another Special text project property, we will add the Customer: Street project property. First we will insert a text element where we will write Customer street and then we will insert the Customer: Street project property special text and place it under Customer name data.
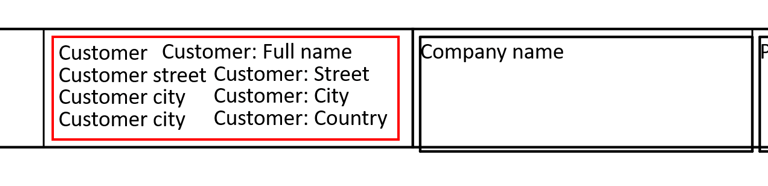
In the same way we can also add the customer city and customer country to be displayed on the plot frame under the customer street data.
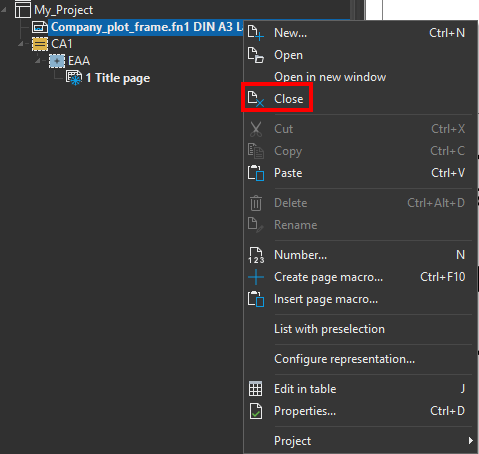
Now we can close this plot frame by right clicking on the plot frame in the page navigator and clicking on the Close command.
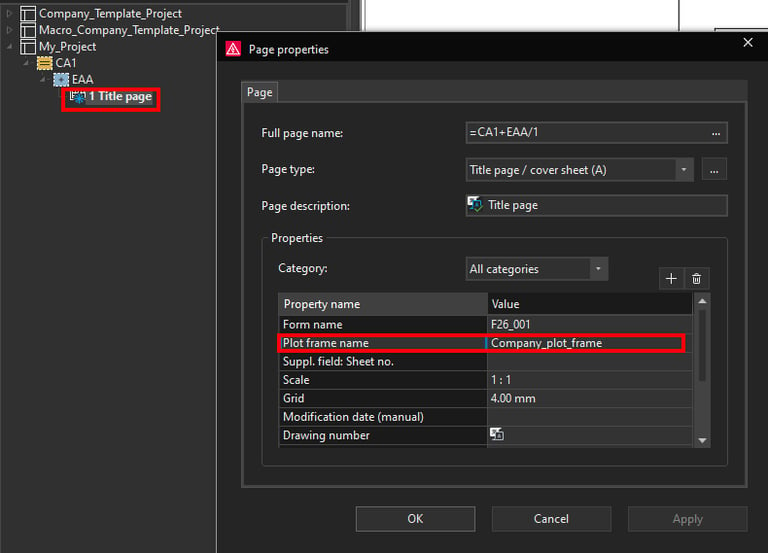
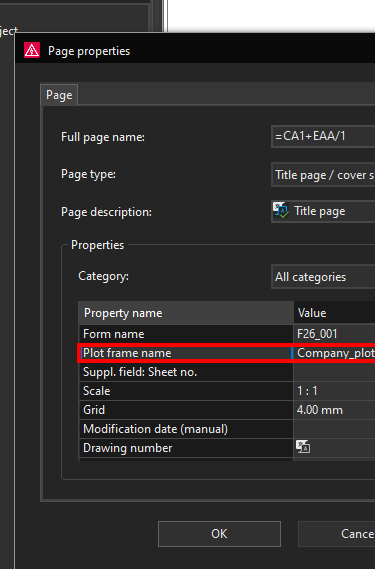
Now we can test the plot frame and the changes that were made by assigning the plot frame to a page. We will use the title page in My_Project for this purpose. We will select the Title page in the page navigator and open the page properties. In the page properties we will assign the newly created plot frame in the Plot frame name row.
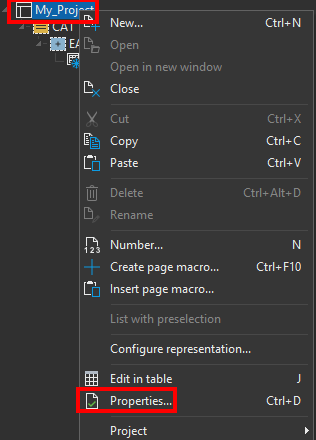
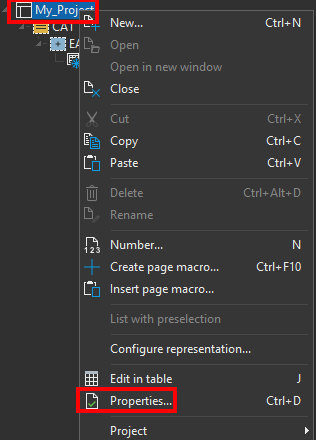
Now we will select the project and open the project properties by clicking on the project in the page navigator and then clicking on Properties.
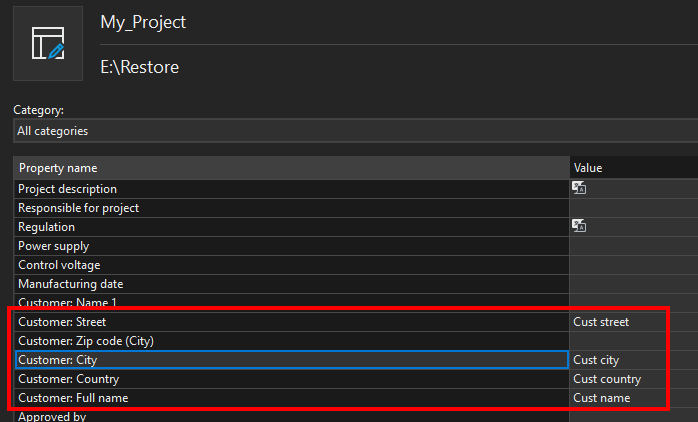
We will enter test data for the project properties that we placed to be shown on to the plot frame.
Now if we go to the title page this data should be visible on the plot frame.